- City Fajr Shuruq Duhr Asr Magrib Isha
- Dubai 04:26 05:44 12:20 15:47 18:50 20:08

In the more than two decades since world leaders first got together to try to solve global warming, life on Earth has changed, not just the climate. It's gotten hotter, more polluted with heat-trapping gases, more crowded and just downright wilder.
The numbers are stark. Carbon dioxide emissions: up 60 per cent. Global temperature: up six-tenths of a degree Fahrenheit. Population: up 1.7 billion people. Sea level: up 3 inches (7.5 centimeters). US extreme weather: up 30 per cent. Ice sheets in Greenland and Antarctica: down 4.9 trillion tons of ice.
"Simply put, we are rapidly remaking the planet and beginning to suffer the consequences," says Michael Oppenheimer, professor of geosciences and international affairs at Princeton University.
Diplomats from more than 190 nations opened talks Monday at a United Nations global warming conference in Lima, Peru, to pave the way for an international treaty they hope to forge next year.
To see how much the globe has changed since the first such international conference — the Earth Summit in Rio de Janeiro in 1992 — The Associated Press scoured data bases from around the world. The analysis, which looked at data since 1983, concentrated on 10-year intervals ending in 1992 and 2013. This is because scientists say single years can be misleading and longer trends are more telling.
Our changing world by the numbers:
Wild Weather
Since 1992, there have been more than 6,600 climate, weather and water major disasters worldwide, causing more than $1.6 trillion in damage and killing more than 600,000 people, according to the Centre for Research on the Epidemiology of Disasters in Belgium, which tracks the world's catastrophes.
While climate related, not all can be blamed on man-made warming or climate change. Still, extreme weather has noticeably increased over the years, says Debby Sapir, who runs the center and its database. From 1983 to 1992 the world averaged 147 climate, water and weather disasters each year. Over the past 10 years, that number has jumped to an average 306 a year.
In the United States, an index of climate extremes — hot and cold, wet and dry — kept by the National Oceanic and Atmospheric Administration has jumped 30 percent from 1992 to 2013, not counting hurricanes, based on 10-year averages.
NOAA also keeps track of U.S. weather disasters that cost more than $1 billion, when adjusted for inflation. Since 1992, there have been 136 such billion-dollar events.
Worldwide, the 10-year average for weather-related losses adjusted for inflation was $30 billion a year from 1983-1992, according to insurance giant Swiss Re. From 2004 to 2013, the cost was more than three times that on average, or $131 billion a year.
Sapir and others say it would be wrong to pin all, or even most, of these increases on climate change alone. Population and poverty are major factors, too. But they note a trend of growing extremes and more disasters, and that fits with what scientists have long said about global warming.
It's this increase that's "far scarier" than the simple rise in temperatures, University of Illinois climate scientist Donald Wuebbles says.
Temperature
It's almost a sure thing that 2014 will go down as the hottest year in 135 years of record keeping, meteorologists at NOAA's National Climatic Data Center say. If so, this will be the sixth time since 1992 that the world set or tied a new annual record for the warmest year.
The globe has broken six monthly heat records in 2014 and 47 since 1992. The last monthly cold record set was in 1916.
So the average annual temperature for 2014 is on track to be about 58.2 degrees Fahrenheit (14.6 degrees Celsius), compared with 57.4 degrees F (14.1 degrees C) in 1992. The past 10 years have averaged a shade below 58.1 degrees F (nearly 14.5 degrees C) — six-tenths of a degree warmer than the average between 1983 and 1992.
Oceans
The world's oceans have risen by about 3 inches (7.5 centimeters) since 1992 and gotten a tad more acidic — by about half a percent — thanks to chemical reactions caused by the absorption of carbon dioxide, scientists at NOAA and the University of Colorado say.
Every year sea ice cover shrinks to a yearly minimum size in the Arctic in September — a measurement that is considered a key climate change indicator. From 1983 to 1992, the lowest it got on average was 2.62 million square miles (6.79 million square kilometers). Now the 10-year average is down to 1.83 million square miles (4.74 million square kilometers), according to the National Snow and Ice Data Center.
That loss — an average 790,000 square miles (2.05 million square kilometers) since 1992 — overshadows the slight gain in sea ice in Antarctica, which has seen an average gain of 110,000 square miles (285,000 million square kilometers) of sea ice over the past 22 years.
On land
The world's population in 1992 was 5.46 billion. Today, it's nearly a third higher, at 7.18 billion. That means more carbon pollution and more people who could be vulnerable to global warming.
The effects of climate change can be seen in harsher fire seasons. Wildfires in the western United States burned an average of 2.7 million acres (1.1 million hectares) each year between 1983 and 1992; now that's up to 7.3 million acres (2.95 million hectares) from 1994 to 2013, according to the National Interagency Fire Center.
And some of the biggest climate change effects on land are near the poles where people don't often see them. From 1992 to 2011, Greenland's ice sheet lost 3.35 trillion tons of ice, according to calculations made by scientists using measurements from NASA's GRACE satellite. Antarctica lost 1.56 trillion tons of ice over the same period.
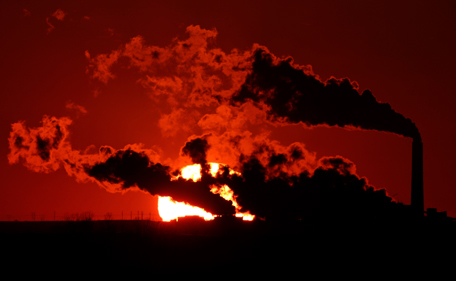
The Air
Scientists simply point to greenhouse gas emissions, mostly carbon dioxide, that form a heat trapping blanket in our air.
There's no need to average the yearly amount of carbon dioxide pollution: It has increased steadily, by 60 percent, from 1992 to 2013. In 1992, the world spewed 24.9 billion tons of carbon dioxide; now it is 39.8 billion, according to the Global Carbon Project, an international consortium.
China has tripled its emissions from 3 billion tons to 11 billion tons a year. The emissions from the U.S. have gone up more slowly, about 6 percent, from 5.4 billion tons to 5.8 billion tons. India also has tripled its emissions, from 860 million tons to 2.6 billion tons. Only European countries have seen their emissions go down, from 4.5 billion tons to 3.8 billion tons.
What Scientists Say
"Overall, what really strikes me is the missed opportunity," Andrew Dessler, a climate scientist at Texas A&M University, says in an email of the data.
"We knew by the early 1990s that global warming was coming, yet we have done essentially nothing to head off the risk. I think that future generations may be justifiably angry about this."
"The numbers don't lie," adds Michael Mann, a climate scientist at Penn State. "Greenhouse gases are rising steadily and the cause is fossil fuel burning and other human activities. The globe is warming, ice is melting and our climate is changing as a result."
![]() Follow Emirates 24|7 on Google News.
Follow Emirates 24|7 on Google News.